Climate Change: From Scientific Discovery to Global Crisis
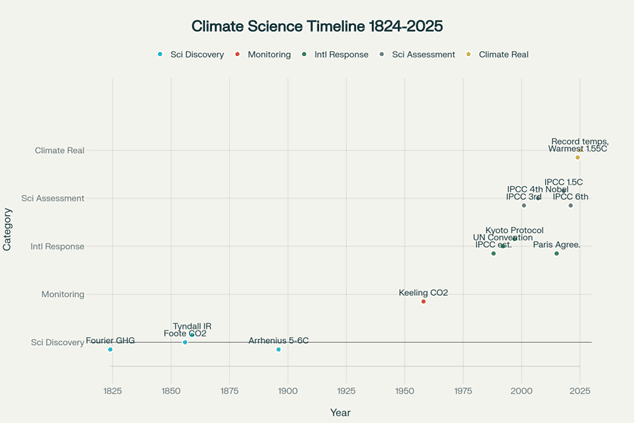
Timeline of Climate Change Science and Global Response (1824–2025)
Climate change is no longer a forecast—it’s our present. This comprehensive climate change timeline traces how nearly 200 years of scientific discovery, observation, and policy have transformed a theoretical idea into today’s global crisis. From the first clues of the greenhouse effect to record heat in 2024–2025, this study shows what’s driving the crisis and which solutions still work—if we act fast.
Climate change represents the defining challenge of our time, encompassing a complex web of scientific understanding, environmental impacts, and societal responses that have evolved over nearly two centuries of research and observation. What began as theoretical inquiries into the Earth’s energy balance by 19th-century physicists has transformed into an urgent global crisis requiring immediate and coordinated action across all sectors of human activity.
The greenhouse effect, first described by Joseph Fourier in 1824 and quantified by Svante Arrhenius in 1896, has become the driving force behind unprecedented climate changes in Earth’s climate system, with global temperatures rising by 1.55°C above pre-industrial levels in 2024—marking the first year to exceed the 1.5°C threshold that scientists have identified as critical for avoiding the most catastrophic impacts.
The consequences of this warming are already manifesting in rising sea levels, melting ice sheets, extreme weather events, and ecosystem disruptions that threaten billions of lives and trillions of dollars in economic activity worldwide.
Historical Foundations: The Discovery of Climate Change Science (1824-1950)
Early Theoretical Foundations
The scientific understanding of climate change began in the early 19th century with foundational discoveries about the Earth’s energy balance and atmospheric composition. Joseph Fourier, the renowned French mathematician and physicist, published his groundbreaking work “Mémoire sur les températures du globe terrestre et des espaces planétaires” in 1824, becoming the first scientist to describe what would later be called the greenhouse effect.
Fourier recognized that the Earth’s surface would be much colder without its atmosphere, explaining that energy from the sun “can easily penetrate the atmosphere and heat the Earth’s surface, which in turn absorbs some of the sun’s radiation” while the atmosphere “absorbs this dark heat and reflects some of it to the surface, reducing thus energy loss to space”.
Building upon Fourier’s theoretical framework, subsequent researchers expanded the understanding of atmospheric physics and heat absorption. Claude Pouillet strengthened the evidence in 1827 and 1838, while Eunice Newton Foote made a crucial experimental breakthrough in 1856 by demonstrating that “the warming effect of the sun is greater for air with water vapour than for dry air, and the effect is even greater with carbon dioxide”.
Foote’s prescient conclusion that “an atmosphere of that gas would give to our earth a high temperature” represented the first experimental evidence linking carbon dioxide concentrations to planetary warming.
Quantifying the Greenhouse Effect
John Tyndall’s meticulous experimental work from 1859 onwards provided the crucial physical measurements that transformed theoretical speculation into quantitative science. Working at the Royal Institution in London with sophisticated apparatus of his own design, Tyndall became the first scientist to measure the infrared absorption and emission properties of various atmospheric gases. His experiments revealed that nitrogen and oxygen, the primary components of the atmosphere, had no effect on heat absorption, while trace gases including water vapor, carbon dioxide, and hydrocarbons demonstrated significant heat-trapping capabilities.
Tyndall’s work established the physical basis of the greenhouse effect with unprecedented precision, leading him to conclude that “the atmosphere admits of the entrance of solar heat; but checks its exit, and the result is a tendency to accumulate heat at the surface of the planet”. His recognition of the climatic implications was equally profound: “if, as the above experiments indicate, the chief influence be exercised by aqueous vapour, every variation of this constituent must produce a change of climate. Similar remarks would apply to the carbonic acid [carbon dioxide] diffused through the air”.
First Climate Change Predictions
Svante Arrhenius’s 1896 calculations marked the transition from qualitative understanding to quantitative climate change prediction. The Swedish chemist, who would later win the Nobel Prize in Chemistry, undertook what he described as “particularly tedious calculations” to estimate the impact of atmospheric carbon dioxide levels on global temperatures. Using the best available data on radiation absorption and global energy balance, Arrhenius predicted that cutting atmospheric CO₂ in half would produce ice age conditions, while doubling CO₂ concentrations would increase global temperatures by 5-6°C.
Remarkably, Arrhenius’s century-old predictions align closely with modern climate change models, which estimate a climate sensitivity of 2.5-4°C for doubled CO₂ concentrations. His work also anticipated human influence on climate, as contemporaneous reports noted his theory that coal combustion could eventually lead to significant climate changes. This prescient recognition of anthropogenic climate change would remain largely dormant for decades until the rapid industrialization of the mid-20th century made human influence on the atmosphere impossible to ignore.
Modern Climate Change Science Era (1950-1988)
The Keeling Curve and Atmospheric Monitoring
The modern era of climate change science began in 1958 when Charles Keeling established continuous carbon dioxide monitoring at the Mauna Loa Observatory in Hawaii. Keeling’s precise measurements, extending over decades, provided the first unambiguous evidence that human activities were systematically altering the composition of Earth’s atmosphere. The resulting “Keeling Curve” showed atmospheric CO₂ concentrations rising from 315 parts per million in 1958 to over 420 ppm by 2024, with the rate of increase accelerating from approximately 1 ppm per year in the 1960s to over 2.5 ppm per year in recent decades.
The Keeling Curve served as a “birth certificate for the monitoring of carbon dioxide in the atmosphere,” providing lasting proof of the influence of human activities on atmospheric composition. The measurements revealed not only the steady upward trend but also annual oscillations reflecting seasonal vegetation cycles, demonstrating the intimate connection between atmospheric chemistry and biological processes. This data became foundational to all subsequent climate research, providing the empirical foundation for understanding the relationship between emissions, atmospheric concentrations, and climate change.
Expanding Scientific Understanding
The period from 1960 to 1980 witnessed rapid expansion in climate science capabilities, including the development of computer models, satellite observations, and ice core analysis techniques. Scientists began constructing increasingly sophisticated general circulation models that could simulate atmospheric and oceanic processes, enabling the first comprehensive assessments of how greenhouse gas increases might affect global climate patterns. Paleoclimate research, including analysis of ice cores from Greenland and Antarctica, revealed that Earth’s climate system was far more sensitive to atmospheric composition changes than previously understood.
These advances culminated in growing scientific consensus about the reality and potential severity of human-caused climate change. By the 1970s, climate scientists were publishing increasingly confident assessments that continued fossil fuel burning would lead to significant global warming, with potentially serious consequences for sea levels, precipitation patterns, and ecosystem stability. However, these scientific findings remained largely within academic circles, with limited public awareness or policy response to the emerging threat.
International Recognition and Response (1988-2015)
The IPCC’s Formation and Early Assessments
The establishment of the Intergovernmental Panel on Climate Change (IPCC) in 1988 marked a crucial transition from scientific research to policy-relevant assessment. Created jointly by the World Meteorological Organization and the United Nations Environment Programme, the IPCC was tasked with providing comprehensive, objective assessments of climate change science for policymakers worldwide. The panel’s formation reflected growing international recognition that climate change represented a global challenge requiring coordinated responses based on the best available scientific evidence.
The IPCC’s First Assessment Report in 1990 provided the scientific foundation for international climate negotiations, concluding that “human activities are increasing the atmospheric concentrations of greenhouse gases, and these increases will enhance the greenhouse effect, resulting on average in an additional warming of the Earth’s surface”. This assessment catalyzed international negotiations that led to the establishment of the United Nations Framework Convention on Climate Change (UNFCCC) in 1992, creating the institutional framework for global climate action.
International Climate Agreements
The 1997 Kyoto Protocol represented the first legally binding international agreement to reduce greenhouse gas emissions, committing developed countries to specific emission reduction targets. While significant as a precedent for international climate cooperation, the Kyoto Protocol suffered from limited participation, with the United States never ratifying the agreement and major developing countries exempt from binding commitments. The protocol’s modest scope—covering only about 30% of global emissions—highlighted the challenges of achieving effective international coordination on climate action.
Despite its limitations, the Kyoto Protocol established important mechanisms including international emissions trading, joint implementation projects, and the Clean Development Mechanism, creating the foundation for modern carbon markets. These innovations demonstrated that climate action could be pursued through flexible, market-based approaches rather than rigid command-and-control regulations. The protocol’s experience also revealed the critical importance of including all major emitters in any effective global climate agreement.
Scientific Consensus Strengthens
The period from 2000 to 2015 witnessed strengthening scientific consensus about climate change, with each successive IPCC assessment report providing greater confidence in both the reality of human influence and the severity of projected impacts. The IPCC’s Fourth Assessment Report in 2007 concluded with high confidence that “warming of the climate system is unequivocal” and that “most of the observed increase in global average temperatures since the mid-20th century is very likely due to the observed increase in anthropogenic greenhouse gas concentrations”. This report’s stark conclusions, combined with growing public awareness of climate impacts, led to the IPCC sharing the 2007 Nobel Peace Prize with Al Gore.
The 2013-2014 Fifth Assessment Report further strengthened these conclusions, stating that it is “extremely likely that human influence has been the dominant cause of the observed warming since the mid-20th century”. The report also provided increasingly precise estimates of climate sensitivity and sea level rise projections, while documenting accelerating changes in ice sheets, glaciers, and precipitation patterns. These assessments provided the scientific foundation for the Paris Agreement negotiations, demonstrating that immediate and substantial emission reductions were necessary to avoid the most severe climate impacts.
The Paris Agreement Era (2015-Present)
Breakthrough in International Cooperation
The Paris Agreement, adopted at COP21 in December 2015, represented a fundamental breakthrough in international climate cooperation by securing commitments from all countries to address climate change. Unlike previous climate agreements that divided countries into rigid categories of developed and developing nations, the Paris Agreement established a framework where all countries would contribute to global emission reductions according to their national circumstances and capabilities.
The agreement’s central goal is to hold “the increase in global average temperature to well below 2°C above pre-industrial levels and to pursue efforts to limit the temperature increase to 1.5°C above pre-industrial levels”. To achieve these temperature targets, the agreement established mechanisms for countries to submit increasingly ambitious nationally determined contributions (NDCs) every five years, creating a framework for progressive strengthening of climate action over time. The agreement also included provisions for climate finance, adaptation support, and technology transfer to assist developing countries in their climate efforts.
Implementation Challenges and Progress
Despite its universal adoption, the Paris Agreement faced immediate implementation challenges, including the United States’ withdrawal under President Trump in 2017 (though the U.S. rejoined under President Biden in 2021 and withdrew again under Trump in 2025). More fundamentally, analysis of initial NDCs revealed that they were insufficient to achieve the agreement’s temperature goals, with projected warming of 2.7-3.1°C even if all commitments were fully implemented.
The agreement’s effectiveness has also been tested by the gap between scientific recommendations and political action. The IPCC’s 2018 special report on 1.5°C warming found that limiting warming to this level would require “rapid, far-reaching and unprecedented changes in all aspects of society,” including a 45% reduction in global CO₂ emissions by 2030 relative to 2010 levels. However, global emissions continued to rise through 2023, reaching record levels of 37.8 gigatons of CO₂ from fossil fuels and industry.
Current Climate Change Reality
As of 2025, the world faces the sobering reality that climate change is accelerating beyond many scientific projections. The year 2024 was the warmest on record globally, with average temperatures reaching 1.55°C above the 1850-1900 baseline—the first year to exceed the 1.5°C threshold that the Paris Agreement sought to avoid. The World Meteorological Organization projects an 86% chance that at least one year between 2025 and 2029 will exceed 1.5°C, with a 70% chance that the five-year average will exceed this critical threshold.
These temperature increases are driving accelerating changes throughout Earth’s climate system. Global mean sea level rose by 4.5 mm in 2023 alone, double the rate observed at the beginning of the satellite record in 1993. The total sea level rise since 1880 now exceeds 270 mm, with the rate of increase accelerating due to both thermal expansion of seawater and increased melting of ice sheets and glaciers. Arctic temperatures are warming at more than twice the global average, while sea ice extent continues to decline and permafrost thaw accelerates.
Physical Impacts and Evidence
Temperature and Heat Extremes
The evidence for global warming has become unambiguous, with multiple independent datasets confirming that global average temperatures have risen by approximately 1.4°C since the late 19th century. Most of this warming has occurred in the past 40 years, with the last decade being the warmest on record. The warming is not uniformly distributed, with land areas warming faster than oceans and polar regions experiencing amplified warming due to ice-albedo feedbacks.
Heat extremes are becoming increasingly frequent and severe, with record-breaking temperatures occurring across all continents. The European heatwave of 2023 saw temperatures exceed 40°C across much of southern Europe, while North American heat domes have produced temperatures above 45°C in regions previously considered temperate. These extreme temperatures are not only uncomfortable but deadly, with heat-related mortality increasing substantially among vulnerable populations including the elderly, outdoor workers, and those without access to air conditioning.
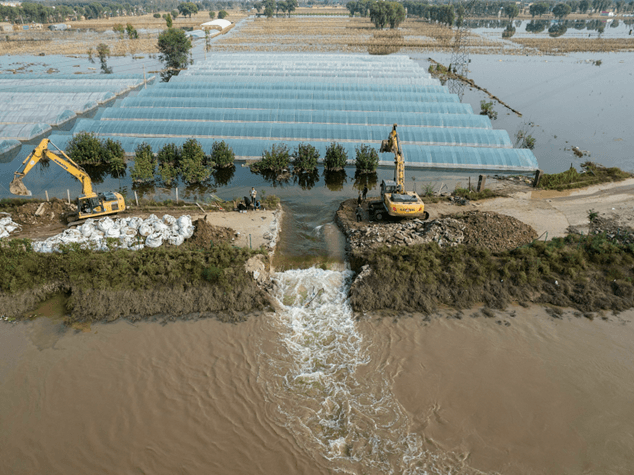
Hydrological Changes and Extreme Weather
Climate change is fundamentally altering Earth’s water cycle, leading to more intense precipitation events, prolonged droughts, and shifting seasonal patterns. Warmer air can hold more moisture, leading to more intense rainfall when precipitation occurs, while also increasing evaporation rates that can intensify droughts. These changes are manifesting in record-breaking extreme weather events, including devastating floods in Europe, prolonged droughts in California and Australia, and unprecedented wildfire seasons across multiple continents.
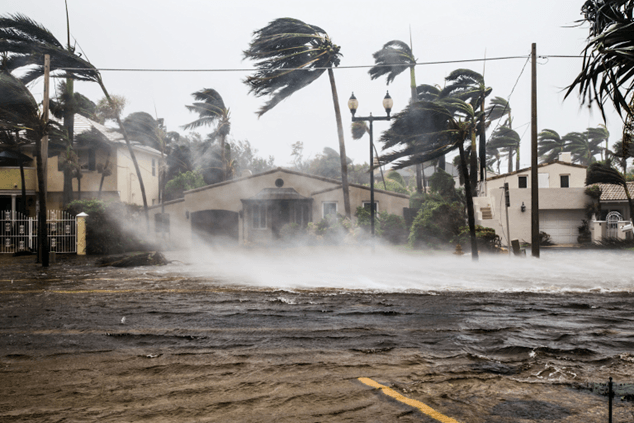
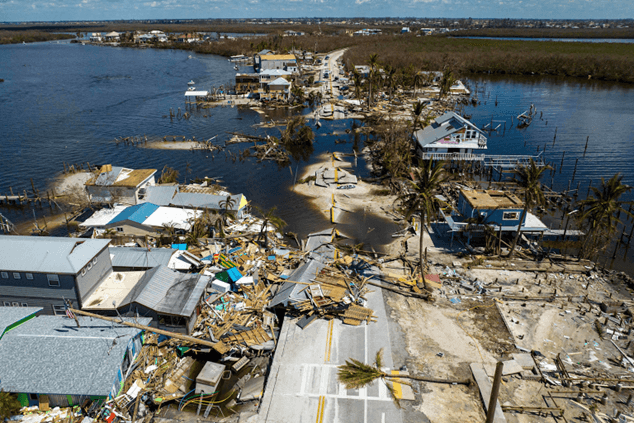
Hurricane and typhoon intensity is increasing as warmer ocean temperatures provide more energy for storm development. While the total number of tropical cyclones may not increase significantly, the proportion of intense storms (Category 4 and 5) is rising, with associated increases in wind speed, precipitation, and storm surge heights. Sea level rise compounds these impacts by providing higher baseline water levels that amplify coastal flooding during storm events.
Ice Sheet and Glacier Changes
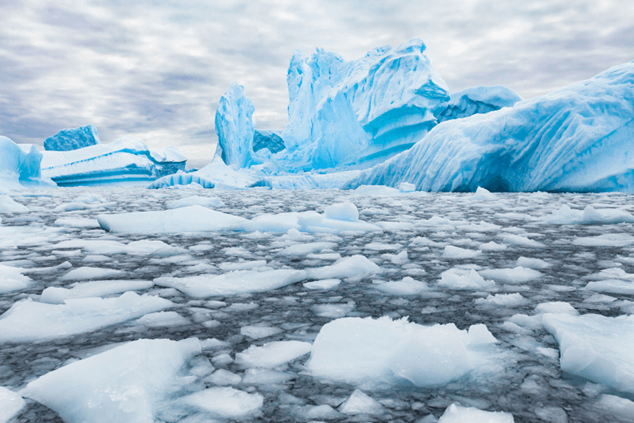
The response of ice sheets and glaciers to warming temperatures has been dramatic and accelerating. NASA’s Gravity Recovery and Climate Experiment (GRACE) data shows that Greenland lost an average of 279 billion tons of ice per year between 1993 and 2019, while Antarctica lost approximately 148 billion tons annually. These mass losses have accelerated significantly in recent decades, with some years seeing losses exceeding 400 billion tons from Greenland alone.
Mountain glaciers worldwide are retreating at unprecedented rates, threatening water supplies for billions of people who depend on seasonal snowmelt and glacier runoff. The retreat is particularly pronounced in tropical mountain regions, where some glaciers have disappeared entirely. Venezuela became the second country in the world to lose all its glaciers in 2024 with the disappearance of Humboldt glacier, while glaciers in the Alps, Himalayas, Andes, and other mountain ranges continue to show accelerating retreat.
Sea Level Rise and Coastal Impacts
Global sea level rise represents one of the most unambiguous indicators of climate change, with satellite measurements showing steady acceleration since reliable monitoring began in 1993. The rate of rise has increased from approximately 2.1 mm per year in 1993 to 4.5 mm per year in 2023, representing a more than doubling of the rate over just three decades. Total sea level rise since 1880 now exceeds 210 mm, with the most recent measurements setting new records annually.
The causes of sea level rise are well understood and directly linked to climate change: approximately 50% results from thermal expansion of seawater as it warms, while the remainder comes from melting glaciers and ice sheets adding water mass to the oceans. Regional variations in sea level change are significant, with some areas experiencing rises of 6-8 inches since 1993 due to local factors including ocean currents, land subsidence, and gravitational effects from melting ice sheets.
Causes and Drivers of Climate Change
Greenhouse Gas Emissions Sources
Human activities have fundamentally altered the composition of Earth’s atmosphere through the emission of greenhouse gases, with atmospheric CO₂ concentrations rising from approximately 280 ppm in pre-industrial times to over 420 ppm in 2025. Global greenhouse gas emissions reached a record 55.4 gigatons CO₂-equivalent in 2023, with fossil fuel combustion contributing 37.8 gigatons of CO₂, land use change adding 3.6 gigatons, methane emissions contributing 9.2 gigatons CO₂-equivalent, nitrous oxide 2.9 gigatons, and fluorinated gases 1.9 gigatons.
The primary sources of these emissions span multiple economic sectors, with electricity and heat production representing the largest single source through coal, oil, and natural gas combustion. Transportation contributes significantly through petroleum consumption in cars, trucks, ships, and aircraft, while industrial processes generate emissions through cement production, steel manufacturing, chemical processing, and other activities. Agriculture produces substantial methane emissions from livestock and rice cultivation, along with nitrous oxide from fertilizer use.
Deforestation and Land Use Change
Deforestation represents a critical driver of climate change, contributing approximately 10-11% of global greenhouse gas emissions annually. Tropical forest loss in 2023 totaled 3.7 million hectares—equivalent to approximately ten soccer fields lost every minute—producing roughly 6% of estimated global CO₂ emissions. The Amazon Basin, Congo Basin, and Southeast Asian forests account for the majority of global deforestation, driven by agricultural expansion, cattle ranching, palm oil production, and logging activities.
The climate impact of deforestation operates through multiple mechanisms beyond direct CO₂ emissions. Forests normally serve as carbon sinks, absorbing CO₂ from the atmosphere during photosynthesis and storing carbon in woody biomass and soils. When forests are cleared or burned, this stored carbon is released to the atmosphere while simultaneously eliminating the forest’s capacity to absorb future emissions. Additionally, deforestation can alter regional precipitation patterns and increase methane emissions from waterlogged soils in cleared areas.
Feedback Mechanisms and Tipping Points
Climate change is accelerated by feedback mechanisms that amplify warming trends beyond the direct effects of greenhouse gas emissions. The ice-albedo feedback represents one of the most significant positive feedbacks, as melting ice exposes darker ocean or land surfaces that absorb more solar radiation, leading to additional warming and further ice melt. Permafrost thaw releases previously frozen carbon in the form of CO₂ and methane, adding to atmospheric greenhouse gas concentrations.
Water vapor feedback amplifies warming because warmer air can hold more moisture, and water vapor itself is a greenhouse gas. As temperatures rise, increased evaporation adds more water vapor to the atmosphere, trapping additional heat and causing further warming. Cloud feedbacks remain more uncertain but could either amplify or dampen warming depending on cloud type, altitude, and distribution patterns.
Climate Projections and Future Scenarios
IPCC Assessment and Scenario Analysis
The IPCC’s Sixth Assessment Report presents five potential future scenarios based on different levels of greenhouse gas emissions and socioeconomic development pathways. These scenarios range from rapid decarbonization leading to 1.5°C warming by 2050 (SSP1-1.9) to continued high emissions resulting in 4.4°C warming by 2100 (SSP5-8.5). The most optimistic scenario requires achieving net-zero global CO₂ emissions around 2050 through unprecedented societal transformation prioritizing sustainability over economic growth.
The middle-of-the-road scenario (SSP2-4.5) projects 2.7°C warming by 2100 if current trends continue with gradual progress toward sustainability but without achieving net-zero emissions. More pessimistic scenarios envision substantially higher warming, with the worst-case scenario projecting temperature increases that would fundamentally alter Earth’s climate system and challenge human adaptation capabilities.
Regional and Sectoral Impacts
Climate projections indicate that impacts will be highly variable across regions and sectors, with particularly severe consequences for vulnerable populations and ecosystems. Arctic regions face the most extreme warming, with winter temperatures projected to increase by more than 3.5 times the global average. This warming will continue reducing sea ice extent, accelerating permafrost thaw, and altering ecosystems that have existed for millennia.
Precipitation patterns show significant regional variation, with wetter-than-average conditions projected for northern Europe, Alaska, and northern Siberia, while the Amazon and other tropical regions may experience increased drying. These changes will profoundly impact agriculture, water resources, and ecosystem stability, potentially displacing millions of people from areas that become uninhabitable due to extreme heat, drought, or sea level rise.
Commitment to Future Changes
Even if all greenhouse gas emissions ceased immediately, committed warming from past emissions would continue for decades due to the long residence time of CO₂ in the atmosphere and thermal inertia of the oceans. Current atmospheric greenhouse gas concentrations already commit Earth to additional warming, sea level rise, and climate system changes that will persist for centuries to millennia. This reality underscores the urgency of emission reductions to limit the magnitude of future changes while simultaneously preparing for the impacts that can no longer be avoided.
Solutions and Mitigation Strategies
Renewable Energy Transition
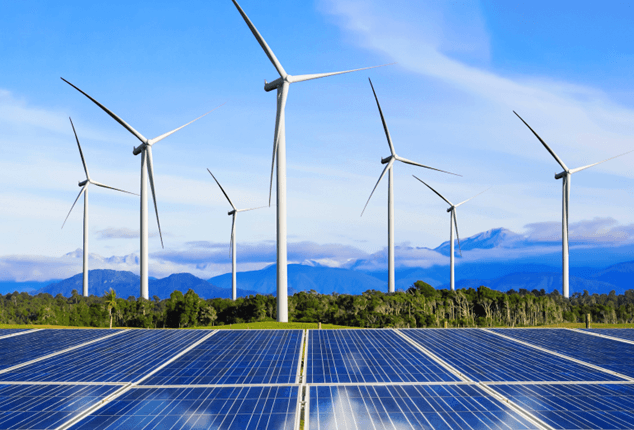
The transition to renewable energy represents the most crucial near-term strategy for reducing greenhouse gas emissions, with wind and solar power emerging as the fastest-growing and most cost-effective solutions. Global renewable energy capacity increased by a record 585 gigawatts in 2024, with renewables representing 92.5% of all new capacity additions. Solar photovoltaic technology dominated this growth, adding 452 GW in a single year—more than three-quarters of the global total.
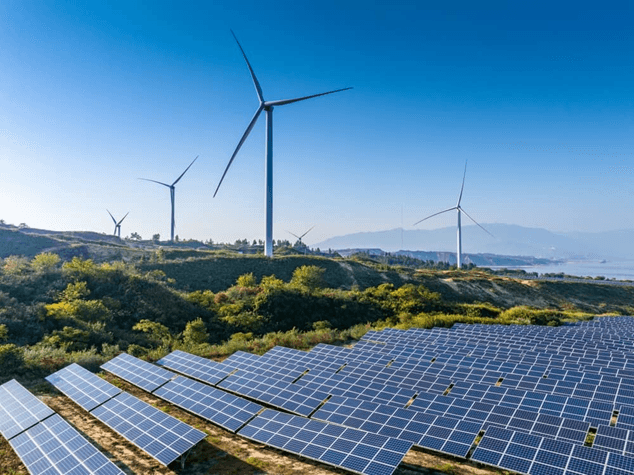
The rapid expansion of renewable energy is driven by dramatic cost reductions that have made wind and solar the cheapest sources of new electricity generation in most regions. Solar capacity is projected to double by 2025, while wind energy continues expanding both onshore and offshore with increasingly sophisticated turbine technologies. Energy storage technologies, including advanced battery systems and hydrogen production, are addressing the intermittency challenges of renewable energy while enabling greater grid flexibility.
Technology and Innovation
Beyond renewable energy, technological innovation across multiple sectors offers pathways for substantial emission reductions. Electric vehicle adoption is accelerating globally, supported by improving battery technology and expanding charging infrastructure. Heat pumps for building heating and cooling, industrial process electrification, and advanced materials are reducing energy demand while enabling electrification of previously fossil fuel-dependent applications.
Carbon capture, utilization, and storage (CCUS) technologies show promise for addressing emissions from hard-to-abate sectors including cement, steel, and chemical production. Direct air capture systems that remove CO₂ directly from the atmosphere are advancing rapidly, though they remain expensive and energy-intensive. Green hydrogen production through renewable-powered electrolysis offers potential for decarbonizing heavy industry, long-distance transport, and energy storage applications.
Nature-Based Solutions
Forest protection and restoration represent critical components of climate mitigation strategies, offering the potential to sequester substantial amounts of atmospheric CO₂ while providing co-benefits for biodiversity and ecosystem services. Protecting existing forests prevents emissions from deforestation while maintaining carbon sinks, while reforestation and afforestation can actively remove CO₂ from the atmosphere. However, the permanence of forest carbon storage faces increasing risks from wildfires, droughts, and other climate-related disturbances.
Regenerative agricultural practices including cover cropping, reduced tillage, and improved grazing management can increase soil carbon storage while maintaining or improving productivity. Wetland restoration and protection offer particularly high carbon storage potential while providing flood control and water quality benefits. Marine and coastal ecosystem protection, including mangrove restoration and seagrass conservation, can sequester “blue carbon” while providing coastal protection against storm surge and sea level rise.
Adaptation Strategies and Resilience
Infrastructure and Built Environment
Climate adaptation requires fundamental changes to infrastructure design and urban planning to address the realities of changing precipitation patterns, extreme temperatures, and sea level rise. Flood protection systems including sea walls, storm barriers, and improved drainage systems are being implemented in coastal cities worldwide. However, hard engineering solutions alone are insufficient, requiring integration with natural systems and consideration of long-term sea level rise projections.
Building codes and design standards must evolve to address changing climate conditions, including increased cooling demands, extreme weather resilience, and flood resistance. Green infrastructure solutions such as permeable pavements, urban forests, and constructed wetlands can provide multiple benefits including stormwater management, urban heat island reduction, and air quality improvement.
Agricultural Adaptation
Agriculture faces severe challenges from changing precipitation patterns, increased temperatures, and extreme weather events, requiring comprehensive adaptation strategies to maintain food security. Drought-resistant crop varieties, improved irrigation efficiency, and modified planting schedules represent key technological adaptations. Diversification of crops and livestock breeds can increase resilience to climate variability while maintaining productivity.
Water management strategies including rainwater harvesting, improved soil moisture retention, and efficient irrigation systems are crucial for adapting to changing precipitation patterns. Agroforestry systems that integrate trees with crops can provide shade, improve soil health, and increase carbon storage while maintaining agricultural productivity. Early warning systems for weather extremes, pests, and diseases enable farmers to take protective actions and minimize losses.
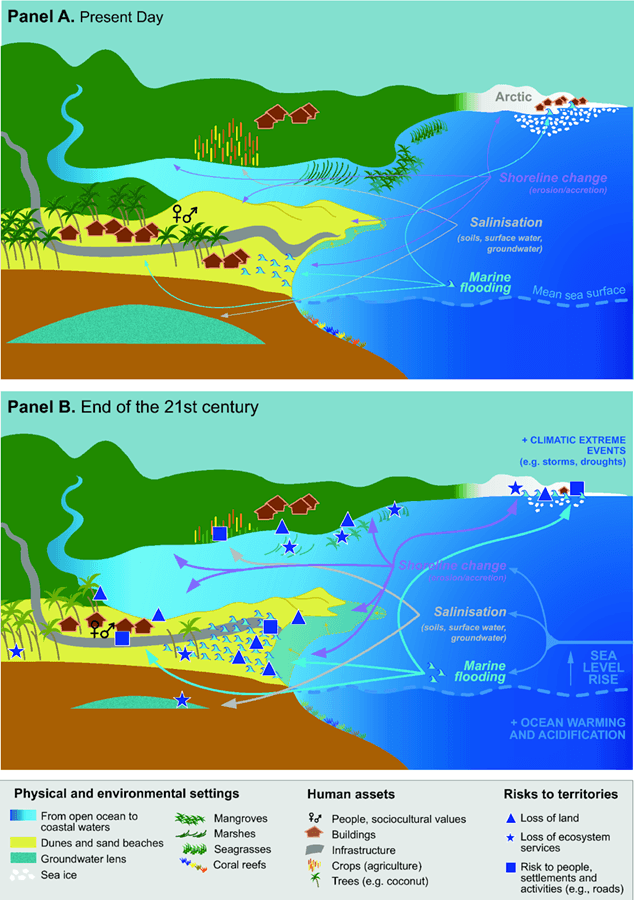
Coastal Protection and Management
Coastal communities face existential threats from sea level rise, increased storm intensity, and coastal erosion, requiring comprehensive adaptation strategies that may include both protection and managed retreat. Beach nourishment and dune restoration can provide natural barriers against storm surge while maintaining recreational and ecological values. Living shorelines that incorporate vegetation and natural materials offer more sustainable alternatives to traditional hard armoring approaches.
For low-lying coastal areas facing inevitable inundation, managed retreat may represent the only viable long-term adaptation strategy. This approach requires careful planning to relocate communities and infrastructure while preserving cultural values and economic opportunities. Early warning systems for coastal flooding and hurricane evacuation procedures can reduce immediate risks while longer-term adaptation measures are implemented.
Economic and Social Dimensions
Economic Impacts and Costs
The economic impacts of climate change are already substantial and accelerating, with annual damages estimated in the hundreds of billions of dollars globally. Extreme weather events including hurricanes, floods, droughts, and wildfires cause direct damage to infrastructure, agriculture, and other assets while disrupting economic activity and supply chains. The European floods of 2024 affected two million people and caused billions in damages, while record-breaking hurricanes and wildfires continue to break previous damage records.
Healthcare costs are rising due to heat-related illnesses, air pollution from wildfires, and vector-borne diseases expanding their geographic range. Agricultural productivity losses from droughts, floods, and changing growing conditions threaten food security while increasing commodity prices. Tourism industries in regions dependent on snow cover, coral reefs, or stable weather patterns face substantial revenue losses from climate impacts.
Social Justice and Equity
Climate change impacts disproportionately affect vulnerable populations including low-income communities, racial and ethnic minorities, and developing countries that have contributed least to historical emissions. These communities often lack resources for adaptation measures such as air conditioning, flood insurance, or relocation away from high-risk areas. Indigenous communities face particular challenges as traditional territories become uninhabitable and cultural practices dependent on specific environmental conditions are disrupted.
International climate justice considerations recognize that developed countries bear primary responsibility for historical emissions while developing countries face the most severe impacts. The Paris Agreement includes provisions for climate finance from developed to developing countries, though the amounts pledged fall short of assessed needs. Loss and damage mechanisms to provide compensation for unavoidable climate impacts remain contentious in international negotiations.
Transition Challenges and Opportunities
The transition to a low-carbon economy presents both challenges and opportunities for workers and communities dependent on fossil fuel industries. Coal mining regions, oil and gas workers, and automotive manufacturers face potential job losses as renewable energy and electric vehicles gain market share. However, many of these workers possess transferable skills applicable to renewable energy installation, grid modernization, and electric vehicle manufacturing.
Just transition policies that provide retraining, economic diversification support, and social protection for affected workers are essential for maintaining political support for climate action. Renewable energy industries are creating substantial employment opportunities, with solar and wind sectors employing millions globally and projected to expand further. Green infrastructure investments can provide employment in construction, maintenance, and operation while delivering climate benefits.
Current Status and Recent Developments
2024-2025 Climate Reality Check
The years 2024 and 2025 have provided sobering evidence that climate change is accelerating beyond many projections, with 2024 marking the first year to exceed 1.5°C above pre-industrial levels. The warmth was not limited to isolated heat waves but represented sustained global temperature elevation driven by continued greenhouse gas emissions and El Niño conditions. Ocean temperatures reached record levels, contributing to coral bleaching events, marine ecosystem disruption, and accelerated ice sheet melting.
Extreme weather events in 2024-2025 demonstrated the increasing intensity and frequency of climate impacts. Latin America and the Caribbean experienced record-breaking hurricanes, devastating floods, debilitating droughts, and unprecedented wildfires that inflicted major socioeconomic damage. European wildfires destroyed 208,000 hectares of forest in the first six months of 2025 alone, while flooding affected millions across multiple continents.
Policy and Political Developments
The political landscape for climate action remains mixed, with some progress undermined by political reversals and insufficient ambition. The United States’ withdrawal from the Paris Agreement in 2025 under the Trump administration represents a significant setback for international cooperation, though other countries have maintained their commitments. China continues expanding renewable energy capacity while also maintaining high coal consumption, creating contradictions in global emission trends.
The COP30 climate conference scheduled for 2025 faces the challenge of addressing the widening gap between climate commitments and scientific requirements. Updated nationally determined contributions must reflect the urgency indicated by accelerating climate impacts and the narrow window remaining to limit warming to 1.5°C. However, political constraints and economic interests continue limiting the ambition of many countries’ climate pledges.
Technological Progress and Deployment
Renewable energy deployment continues at record pace, with 2024 seeing unprecedented additions of solar and wind capacity. Solar photovoltaic installations exceeded 450 GW globally, while wind power added over 100 GW. Energy storage deployment is accelerating alongside renewable energy, with battery costs continuing to decline and deployment scales increasing rapidly.
Electric vehicle adoption is accelerating in many markets, though progress remains uneven globally. Battery technology improvements continue reducing costs while increasing range and charging speed, addressing key barriers to mass adoption. However, charging infrastructure deployment lags vehicle availability in many regions, limiting adoption potential.
If you’d like to explore more topics or to access the required quiz for purchasing your raffle ticket, visit our main Quiz & Studies page.
Quiz
Each study material comes with a short practice quiz at the end. These quizzes are completely optional and designed to help you review what you’ve learned and prepare for the Big Quiz.
💡 Use them to test your knowledge in a fun, low-pressure way – no email or name required.
We’re always improving and updating our content. If you spot anything that seems off, don’t hesitate to reach out – your feedback truly matters to us!
👉 Ready to test yourself? Start the Practice Quiz below:
#1. What percentage of global greenhouse gas emissions does deforestation contribute annually?
#2. What was the global temperature anomaly in 2024, making it the first year to exceed a critical threshold?
#3. In which year was the Paris Agreement on climate change adopted?
#4. What is the main goal of the Paris Agreement regarding global temperature rise?
#5. Who was the first scientist to describe the greenhouse effect in 1824?
Results

Great job! You’ve got a clear grasp of the science and solutions behind climate change. Keep the momentum—every informed choice helps bend the curve.

Close! Revisit the essentials—greenhouse effect, Paris goals, and key impacts—then try again. Understanding the basics is the first step to real-world impact.